Researchers turn SERS signal fluctuations into concentration fingerprints, enabling reliable ultrasensitive quantitation across diverse applications
CHENGDU, SICHUAN PROVINCE, CHINA, September 15, 2026 /EINPresswire.com/ — Researchers turn SERS signal fluctuations into concentration fingerprints, enabling more reliable ultrasensitive quantitation across diverse chemical and biological applications
Researchers at Capital Normal University and the Henan Academy of Sciences have found that random SERS fluctuations are more than experimental noise: the full intensity distribution evolves systematically with analyte concentration. By combining these concentration-encoded statistical patterns with a compact ResNet4 model, the team accurately identified concentration levels for a model dye, methamphetamine, pesticide residues, and a drug in artificial serum, opening a new route to reliable ultrasensitive SERS quantitation.
Why ultrasensitive SERS remains difficult to quantify?
From food safety and environmental monitoring to drug analysis, early diagnosis, and public security, analytical tests must often determine whether a target substance is present and how much is there. At trace or single-molecule levels, the signal must be detectable, chemically specific, and accurate enough for quantitative decisions.
Raman spectroscopy identifies molecules through characteristic vibrational peaks, making it useful for selective detection in complex samples. However, ordinary Raman scattering is weak. Surface-enhanced Raman scattering (SERS) overcomes this limitation by placing molecules near gold or silver nanostructures. Localized plasmonic “hot spots,” particularly within nanoscale gaps, can amplify Raman signals by many orders of magnitude, enabling single-molecule detection.
However, extreme sensitivity also makes quantitation challenging. At very low concentrations, molecules enter hot spots randomly, while their numbers, locations, and local enhancement vary across space and time. Consequently, spectra from the same concentration can differ substantially, and conventional calibration based on peak intensity or its average can be affected by rare bright events, substrate differences, and batch variation.
Digital SERS has recently improved single-molecule quantitation by converting measurements into binary events (signal present or absent) and using event probability with Poisson statistics to infer concentration [Nature 628, 771 (2024); Nano Lett. 24, 11116 (2024)]. Although important, binary conversion discards signal amplitude, distribution width, skewness, and local shape, and generally relies on stringent single-molecule conditions. The researchers therefore asked whether fluctuations usually treated as an obstacle might instead contain concentration information. Could the complete intensity distribution transform apparently random variation into a recognizable statistical fingerprint?
Turning SERS intensity distributions into concentration fingerprints
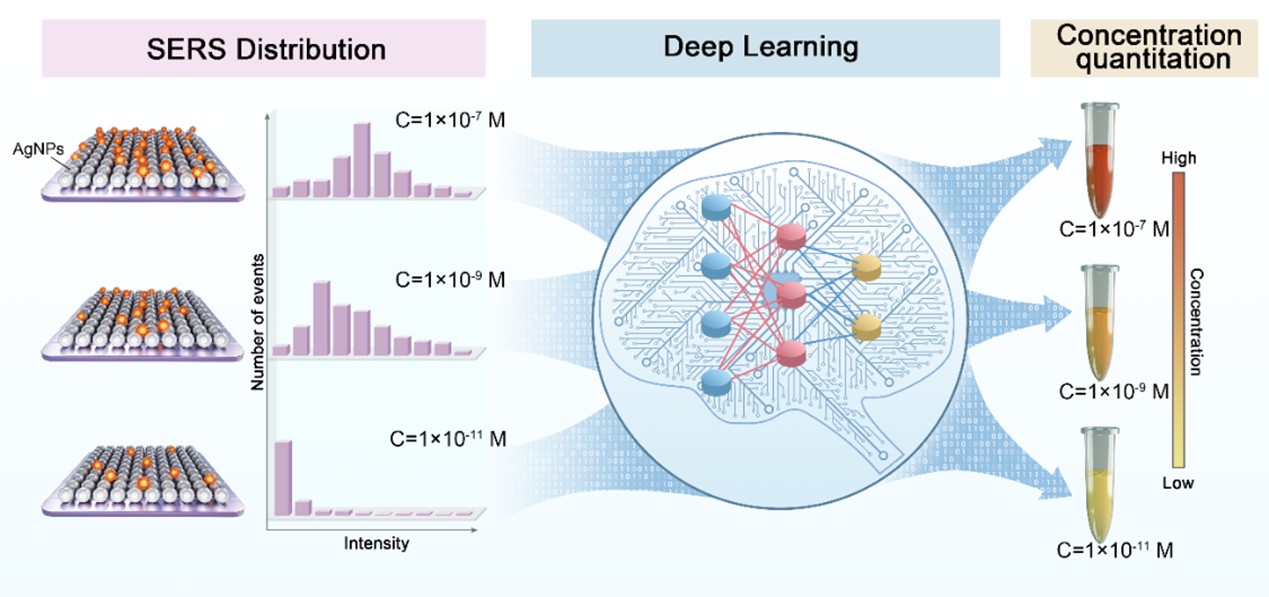
The team, led by Capital Normal University, China, and the Henan Academy of Sciences, China, developed a statistical SERS strategy based on “concentration-encoded intensity distributions.” Instead of treating a single measurement or mean peak height as the sole indicator, the researchers collected spectra at many positions, assembled characteristic peak intensities into a histogram, and used a compact one-dimensional residual neural network, ResNet4, to recognize the distribution pattern associated with each concentration. The concept is simple: preserve the fluctuations, understand their origin, and use them. The study was recently published online in Opto-Electronic Advances (OEA) on August 27, 2026.
The team prepared relatively uniform silver nanoparticle arrays using the Langmuir-Blodgett method and used rhodamine 6G (R6G) as a model analyte. SERS mapping measurements were recorded over 30 μm × 30 μm areas. Conventional peak-intensity analysis showed the familiar problem: although the mean signal generally increased with concentration, point-to-point variation remained large. At 1 × 10⁻⁹ M, the relative standard deviation of the 612 cm⁻¹ band was 37.9%, while calibration slopes and intercepts varied between substrate batches.
When the same mapping data were viewed as distributions, however, a reproducible trend emerged. As R6G concentration increased from 1 × 10⁻¹¹ to 1 × 10⁻⁷ M, the statistical histograms evolved continuously from a highly skewed long tail to an almost symmetric Gaussian-like profile; skewness fell from 3.515 to 0.086. Thus, concentration information was encoded not only in average signal strength but also in the shape of the entire measurement population.
Physical modeling supported this finding using Poisson statistics, generalized Mie theory, and Monte Carlo simulations of molecules randomly adsorbed in a plasmonic hot spot formed by two 60 nm silver nanoparticles. As the number of contributing molecules increased, the simulated distributions shifted from long-tailed to nearly Gaussian. A smaller 1 nm gap produced stronger fields and greater low-concentration asymmetry but did not change this overall transition. Thus, hot-spot strength shapes the distribution, while molecule number fluctuations drive its concentration-dependent evolution.
ResNet4 was trained and tested using independent SERS substrate batches and mapping measurements. For five R6G concentrations from 1 × 10⁻¹¹ to 1 × 10⁻⁷ M, it achieved 100% identification accuracy and outperformed KNN and SVM models. Performance remained strong across other analytes and matrices: methamphetamine in methanol was classified from 1 ppb to 10 ppm with 99.6% average accuracy; thiram in bean-sprout extract reached 99% from 1 × 10⁻⁸ to 1 × 10⁻⁶ M; and rosiglitazone maleate in methanol-treated artificial serum matrices reached about 96% from 1 × 10⁻⁷ to 1 × 10⁻⁵ M.
Unlike binary “0/1” counting, this strategy retains the full continuous SERS intensity distribution. Molecule number fluctuations, hot-spot enhancement differences, distribution width, skewness, and overall profile become useful information, turning SERS stochasticity from quantitative “noise” into a “concentration fingerprint.” This broader statistical basis reduces reliance on single-molecule binarization and offers a promising route toward reliable ultrasensitive quantitation in chemical analysis, biosensing, food safety, environmental monitoring, and public security.
Reference
Title of original paper: Statistical SERS spectroscopy based on concentration-encoded intensity distributions for deep-learning-assisted quantitation
Journal: Opto-Electronic Advances
DOI: https://doi.org/10.29026/oea.2026.260163
About Professor Zhipeng Li from Capital Normal University
Dr. Zhipeng Li, a Professor and Doctoral Supervisor in the Department of Physics at Capital Normal University, China. His research focuses on plasmonic nanophotonics, nanoscale optical-field manipulation, and ultrasensitive-enhanced spectroscopy. He has led numerous nationally and municipally funded projects, published more than 60 SCI-indexed papers in journals including PNAS, Advanced Materials, Nano Letters, ACS Nano, and Opto-Electronic Advances.
About Professor Hongxing Xu from Henan Academy of Sciences
Prof. Hongxing Xu, an academician of the Chinese Academy of Sciences, is President of the Henan Academy of Science, China. His research covers plasmonic photonics, molecular spectroscopy, and nanophotonics. He revealed the intense electromagnetic enhancement generated in nanogaps between paired metallic nanoparticles, establishing an important physical foundation for single-molecule SERS. His contributions also span plasmonic optical forces, single-molecule trapping, surface-enhanced spectroscopy, tip-enhanced Raman spectroscopy, plasmon-assisted catalysis, and nanowire plasmonics. He has published more than 300 papers in journals including Physical Review Letters, Nature Photonics, Science Advances, and PNAS, and has received numerous national honors.
About Associate Professor Longkun Yang from Capital Normal University
Dr. Longkun Yang, an associate professor in the Department of Physics at Capital Normal University, China. His research centers on plasmonic nanophotonics and SERS, particularly single-molecule SERS, microfluidic Raman chips, and robust quantitative analysis. He has led projects funded by the National Natural Science Foundation of China and participated in National Key R&D Program projects. He has published more than 20 SCI-indexed papers.
Funding information
The authors gratefully acknowledge financial support from the Beijing Natural Science Foundation (No. Z240005), National Key Research and Development Program of China (No. 2021YFA1400800), National Natural Science Foundation of China (No. 12374028 and 12474033), Extreme Light Field Manufacturing Science and Engineering (No. 52488301), Research on Water-guided Laser Processing System and Key Technologies for Superhard Materials (No. 231723002), Natural Science Foundation for Youths of Inner Mongolia Autonomous Region (No. 2026QC0418), Elite Revitalizing Inner Mongolia Program (No. 2025TGL05), Interdisciplinary Project of Capital Normal University (No. 2026JCYY04).
Siyi Ma
Institute of Optics and Electronics, Chinese Academy of Scie
email us here
Legal Disclaimer:
EIN Presswire provides this news content “as is” without warranty of any kind. We do not accept any responsibility or liability
for the accuracy, content, images, videos, licenses, completeness, legality, or reliability of the information contained in this
article. If you have any complaints or copyright issues related to this article, kindly contact the author above.

Media gallery